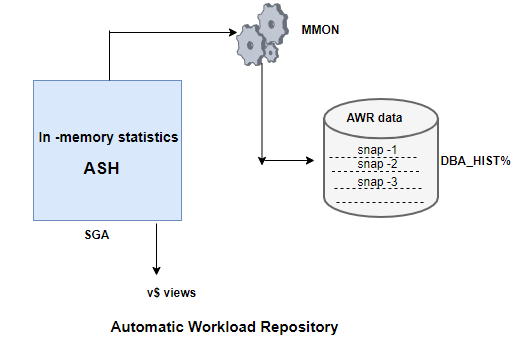
What is Automatic Workload Repository(AWR)
Automatic Workload Repository is a important part implemented in Oracle database 10g and above. It replaces the statspack utility. Since it is collected from SGA directly,performance impact is quite low.
Automatic Workload Repository (AWR) is a collection of persistent system performance statistics owned by the SYS user. It resides in SYSAUX oracle tablespace. By default snapshot are generated once every 60 min and maintained for 7 days. AWR report are used to investigate performance and other issues
The new MMON process is responsible for collecting data and populating the AWR
Oracle Supplied AWR Scripts
awrrpt.sql
Depending on the reasons for collecting the report, the default can be used, or for a more focused view, a short 10-15 minute snapshot could be used
awrrpti.sql
Displays statistics for a range of snapshot Ids on a specified oracle database and instance.
awrsqrpt.sql
Displays statistics of a particular SQL statement for a range of snapshot Ids. Run this report to inspect or debug the performance of a particular SQL statement.
awrsqrpi.sql
Displays statistics of a particular SQL statement for a range of snapshot Ids on a specified SQL.
awrddrpt.sql
Compares detailed performance attributes and configuration settings between two selected time periods.
awrddrpi.sql
Compares detailed performance attributes and configuration settings between two selected time periods on a specific database and instance.
Features of AWR repository
AWR collects data in the following categories:
• Base Statistics – general database performance metrics since instance start-up.
• SQL – statistics for each executed SQL statement (# executions, # physical reads, etc)
• Deltas – the rate of change of important stats over time. Similar to our collection technologies that do
before and after snapshots and only show the deltas over the specified period of time.
• Expert Advice – results of the expert analysis engine provided in 10g.
AWR is automatically installed and running with 10g. The new MMON process is responsible for collecting data and populating the AWR. The MMON process takes snapshots of performance data at regular intervals and inserts that data into the AWR tables. The tables containing AWR information are stored in the SYSAUX tablespace (also new in 10G ) under the SYS schema. The AWR related tables all begin with “WR”
WRM$_WR_CONTROL
 WRI$_AGGREGATION_ENABLED
 WRI$_ADV_USAGE
 WRI$_ADV_TASKS
 WRI$_ADV_SQLW_TABVOL
 WRI$_ADV_SQLW_TABLES
 WRI$_ADV_SQLW_SUM
 WRI$_ADV_SQLW_STMTS
 WRI$_ADV_SQLW_COLVOL
 WRI$_ADV_SQLT_STATISTICS
 WRI$_ADV_SQLT_RTN_PLAN
 WRI$_ADV_SQLT_PLANS
 WRI$_ADV_SQLT_BINDS
 WRH$_LATCH_CHILDREN_BL
 WRH$_LATCH_BL
 WRH$_JAVA_POOL_ADVICE
 WRH$_INSTANCE_RECOVERY
 WRH$_FILESTATXS_BL
 WRH$_FILEMETRIC_HISTORY
 WRH$_EVENT_NAME
 WRH$_ENQUEUE_STAT
 WRH$_DLM_MISC_BL
 WRH$_DB_CACHE_ADVICE_BL
The third letter of each table name signifies the type of data that it contains
I – advisory functions (SQL Advice, Space Advice, etc)
• M – metadata information
• H – historical data
Oracle also adds views on top of these base tables. The views all begin with DBA_HIST.Some of the oracle views are given below
Workload Repository Views
V$ACTIVE_SESSION_HISTORY – Displays the active session history (ASH) sampled every second.
DBA_HIST_ACTIVE_SESS_HISTORY – Displays the history contents of the active session history.
DBA_HIST_BASELINE – Displays baseline information.
DBA_HIST_DATABASE_INSTANCE – Displays database environment information.
DBA_HIST_SNAPSHOT – Displays snapshot information.
DBA_HIST_SQL_PLAN – Displays SQL execution plans.
DBA_HIST_WR_CONTROL – Displays AWR settings.
Useful Operations on AWR
(a) How to Modify the AWR snapshot settings
BEGIN
 DBMS_WORKLOAD_REPOSITORY.modify_snapshot_settings(
 retention => 21600,        -- Minutes (21600 = 15 Days).
 -- Current value retained if NULL.
 interval  => 60);          -- Minutes. Current value retained if NULL.
 END;
 /
(b) Dropping the AWR snaps in range
BEGIN
 DBMS_WORKLOAD_REPOSITORY.drop_snapshot_range(
 (low_snap_id=>40,
 High_snap_id=>80);
 END;
 /
(c) Creating a SNAPSHOT Manually
BEGIN
 DBMS_WORKLOAD_REPOSITORY.create_snapshot();
 END;
 /
(d) Creating Baseline
BEGIN
   DBMS_WORKLOAD_REPOSITORY.create_baseline (
     start_snap_id => 10,
     end_snap_id   => 100,
     baseline_name => 'AWR First baseline');
 END;
 /
(e) Creating Baseline template
In 11g, there is a newly introduced procedure DBMS_WORKLOAD_REPOSITORY.CREATE_BASELINE_TEMPLATE that specifies a template for how baselines should be created for future time periods
BEGIN
 DBMS_WORKLOAD_REPOSITORY.CREATE_BASELINE_TEMPLATE (
 start_time => to_date('&start_date_time','&start_date_time_format'),
 end_time => to_date('&end_date_time','&end_date_time_format'),
 baseline_name => 'MORNING',
 template_name => 'MORNING',
 expiration => NULL ) ;
 END;
 /
(f) Dropping a baseline
BEGIN
     DBMS_WORKLOAD_REPOSITORY.DROP_BASELINE (
     baseline_name => 'AWR First baseline');
 END;
 /
(g) current settings for AWR retention and interval parameters
select
    extract( day from snap_interval) 2460+
    extract( hour from snap_interval) *60+
    extract( minute from snap_interval ) "Snapshot Interval",
    extract( day from retention) *24*60+
    extract( hour from retention) *60+
    extract( minute from retention ) "Retention Interval"
 from
    dba_hist_wr_control;
(h) How to check the snapshot currently in AWR
SELECT snap_id, begin_interval_time, end_interval_time FROM dba_hist_snapshot ORDER BY 1;
(i) How to find the snapshot generated on particular day
select snap_id,to_char(BEGIN_INTERVAL_TIME,'DD-MON-YY HH24:MI:SS') "Runtime"
 from dba_hist_snapshot
 where to_char(BEGIN_INTERVAL_TIME,'DD-MON-YY')='01-SEP-19' order by snap_id;
How to generate AWR reports for Performance issues
- Collect the AWR report for good time and bad time and then compare it
- We have to very specific about the time and stick to it
- It is good to generate the AWR report for shorter duration then longer duration
- If you have a Oracle RAC, then generate the AWR report on each instance in the same time frame
Top things to take a look in Automatic Workload Repository Reports
(1) Instance Efficiency Percentages
(2) Top 5 Timed Foreground Events
(3) SQL Ordered by Elapsed Time:
Here look for query has low executions and high Elapsed time per Exec (s) and this query could be a candidate for troubleshooting or optimizations.
(4) SQL Ordered by CPU Time
Here look for query having high CPU and this query could be a candidate for troubleshooting or optimizations.
Also Read
Active Session History
sql tuning advisor
Top AWR useful queries for R12.2/R12.1 Upgrade
Oracle Performance tuning Glossary
Oracle Explain plan
https://docs.oracle.com/database/121/RACAD/GUID-C3CD2DCE-38BD-46BA-BC32-7A28CAC9A7FD.htm#RACAD951