We have already posted on Autotrace in Oracle, tkprof, and sql trace. Here we will be looking for the Oracle Explain Plan utility and how we can effectively use it to tune the Oracle sql statement
What is Explain Plan in Oracle
- Oracle database internally creates a query execution plan in order to fetch the desired data from the physical tables. The query execution plan is nothing but a set of methods on how the database will access the data from the tables. This query execution plan is crucial as different execution plans will need different cost and time for the query execution
- It shows the execution path of an SQL statement
- it indicates what tables it will read first and in what order
- it indicates what indexes it will use, or if new indexes are needed
- It Helps verify that Oracle will retrieve the data the way you expect it to
How to find the Oracle Explain Plan?
Must have full access to a PLAN_TABLE or create PLAN_TABLE with utlxplan.sql delivered by Oracle
Insert the following command at the top of your SQL statement
SQL> explain plan for <sql statement>;
Explained
SQL> select * from table(dbms_xplan.display);

Example

SQL> explain plan for select * from dual;
Explained
SQL> select * from table(dbms_xplan.display);
PLAN_TABLE_OUTPUT

| Id | Operation | Name | Rows | Bytes | Cost |
| 0 | SELECT STATEMENT | | 1 | 2 | 2 |
| 1 | TABLE ACCESS FULL | DUAL | 1 | 2 | 2 |
Note: cpu costing is off
With multiple statements, you can specify a statement identifier and use that to identify your specific execution plan
explain plan
set statement_id = '<identifier>'
into plan_table
for  <sql statement>
;

Example
explain plan
set statement_id = 'x1'
into plan_table
for select user_name, user_id from emp
;
Once this is executed, we can view the explain plan with the help of the below queries. This does not execute the query, it just creates the explain plan
col operation format a13 trunc
col options format a15 trunc
col object_name format a23 trunc
col id format 9999
col parent_id format 9999
col position format 9999
col operations format a25
select lpad(' ',2*level) || operation operations,options,object_name
from plan_table
where statement_id = 'x1'
connect by prior id = parent_id and statement_id = 'x1'
start with id = 1 and statement_id = 'x1'
order by id;

Or
SQL> set linesize 132
SQL> SELECT * FROM TABLE(dbms_xplan.display);
or
SQL> set linesize 132
SQL> SELECT * FROM TABLE(dbms_xplan.display(statement_id=>'x1'));
If you want the output in HTML format, you can use the below query
set pages 0 head off
set linesize 132
set long 1000000
col xplan format a100
spool id1.html
SELECT dbms_xplan.display_plan(statement_id => 'id1',type=>'HTML') AS XPLAN
FROM dual;
spool off;
if you want additional information, you can execute the below statement
SELECT *
FROM TABLE(DBMS_XPLAN.DISPLAY (FORMAT=>'ALL +OUTLINE'))
Why is it important to find an Explain Plan?
Using the Explain Plan allows developers and database administrators to understand how the Oracle optimizer will process an SQL statement. This can assist in identifying performance bottlenecks, and inefficient operations, and provides hints on how to optimize the query.
How to Read the Explain Plan
- Read innermost out, top/down
- Join operations always require two sets. The order you read the sets is top-down, so the first set is the driving set and the second is the probed set. In the case of a nested loop, the first set is the outer loop. In the case of a hash join, the first set is used to build the hash table.
- One join is performed at a time, so you only need to consider two sets and their join operation at any one time.
Let’s take an example
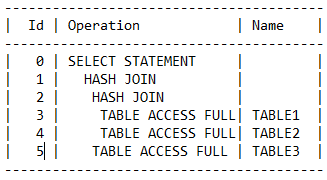
Here the complete order will be 3,2,4,2,1,5,1,0
(a) It will first go to step 3, do a full table scan, and pass the rows to step 2 which will build the hash table
(b) It will go to 4 select the rows and give the rows to step 2. Here Hash join will be done.
(c) Now the rows selected will be given to step 1 which will build the hash table
(d) It will go to step 5, select the rows, and pass it to step 1. Here Hash join will be done.
(e) Since no more children, it will output the rows in step 0
What is the COST column in Plan?
- The COST column in an Explain Plan provides an estimate of the resources required to execute the operation.
- A lower cost usually indicates a faster operation, but it’s relative and not always an absolute measure of performance.
What is the Cardinality in Plan
Cardinality is the Expected number of rows to be processed. This gets defined by different aspects like Dynamic Sampling, and Data Distribution in the joining column. Optimizer stats play an important role here
What is the Bytes in Plan
Estimate by the query optimization approach of the number of bytes accessed by the operation
What to look for?
-Look for TABLE ACCESS… (FULL) …
-Costly if the table is big
-Costly if performed many times
-Look for INDEX… (RANGE SCAN)…
-Expected for non-unique indexes
-Suspicious for unique indexes
Joins Info from Tuning Perspective
Nested Loops
- Good for online screens and reports
- Read all rows from Table 1
- Then access Table 2 once for each row returned from Table 1
- Fastest if rows returned from table 1 are small, access to table 2 is inexpensive.
- This means either a UNIQUE lookup or a SMALL Range Scan.
Merge Join
- Better than nested loops for joining a large number of rows
Hash Join
- Common in Parallel Queries
- Better than Merge Join
- The smallest table is passed over and a hashing algorithm is applied to each row to create a hash table and a bitmap.
- The second table is passed over and a hashing algorithm is applied and checks for match (ie. joins)
- The bitmap is used as a quick lookup and is especially useful when the hash table is too large to fit in memory.
Sort Merge Join
- Rows are produced from Table 1 and are then sorted
- Rows are produced from Table 2 and sorted by the same sort key as Table 1
- Tables 1 and 2 are NOT accessed concurrently
- Sorted rows from both sides are then merged together(joined)
How to change the Oracle Optimizer Plan
We can influence Oracle optimizer decisions using the below means
- Using optimizer hints
- Gathering statistics
- creating or modifying indexes
- Restructuring SQL
Always test changes in a non-production environment first.
how to get an execution plan in Oracle using sql_id in Cursor
If the statement is in Cursor( Shared pool), we can find the Explain plan taken by Oracle to execute the query using the below query. Here you need to provide the SQL_ID of the sql statement
col operation for a20
col object_name for a20
col options for a20
col optimizer for a12
col child_number a3
SELECT child_number, id , lpad (' ', depth) || operation operation , options , object_name , optimizer , cost
FROM V$SQL_PLAN
WHERE sql_id = '&sql_id'
ORDER BY child_number, id;

OR
select * from table(dbms_xplan.display_cursor('&1', NULL, 'ALL'));

OR
select * from table( DBMS_XPLAN.display_cursor('&1', NULL,'ADVANCED ROWS ALLSTATS'));
The above statement will provide lot of additional information
how to get an execution plan in Oracle using SQL_ID in AWR/how to get an old execution plan in Oracle
If a sql statement has been executed in the past and it is in the Oracle Automatic Workload Repository, then we can find the Explain plan using the below command
select * from table( DBMS_XPLAN.DISPLAY_AWR('&1', NULL,NULL,'ADVANCED ROWS ALLSTATS'));
This will list all the available plans in AWR and this will include the old execution plan also
Actual Sql execution plan
The plan you get through by using the Explain plan command is not an actual execution plan, it is the estimated execution plan. Oracle may choose a different plan at the time of execution depending on the table statistics and bind variable. So sometimes it will be better to execute the query and then find the Explain plan for the query in V$SQL_PLAN
How to find the change in the Explain plan in Oracle for an SQL ID
Many times because of stats issues, additions in the index, and other parameters, the SQL starts performing badly. One of the reasons could be a change in the execution plan of the sql. The below sql will show the history of all the execution/explain plans taken by the particular sql. This is very useful when your developer complains about performance on the sql query which was running nicely yesterday
set lines 155
col execs for 999,999,999
col avg_etime for 999,999.999
col avg_lio for 999,999,999.9
col begin_interval_time for a30
col node for 99999
break on plan_hash_value on startup_time skip 1
SELECT ss.snap_id,
ss.instance_number node,
begin_interval_time,
sql_id,
plan_hash_value,
NVL(executions_delta,0) execs,
(elapsed_time_delta/DECODE(NVL(executions_delta,0),0,1,executions_delta))/1000000
avg_etime,
(buffer_gets_delta /DECODE(NVL(buffer_gets_delta,0),0,1,executions_delta))
avg_lio
FROM DBA_HIST_SQLSTAT S,
DBA_HIST_SNAPSHOT SS
WHERE sql_id = NVL('&sql_id','fhf133jjk234')
AND ss.snap_id = S.snap_id
AND ss.instance_number = S.instance_number
AND executions_delta > 0
ORDER BY 1,2,3
/
Related Articles
How to find the change in explain plan in oracle for a sql id
sql tuning advisor
Nested Loop Join in Oracle 11g
Hash join in Oracle with example
Various Joins Method in Oracle
Query to find full table scans in oracle
https://docs.oracle.com/cd/B19306_01/server.102/b14211/ex_plan.htm
I Got your reference from bobbydurrett’s blog… I really like the concepts you discuss here…
Thanks Niraj