We saw how to enable trace in Oracle in an earlier post. The trace files obtained from the method are in raw form which can be converted into a more readable format using the tkprof utility in Oracle (Transient Kernel PROFile utility)
tkprof utility in Oracle
- TKPROF is a tool for producing formatted reports from SQL Trace files (also known as event 10046 trace files).
- Each SQL (and PL/SQL) statement appearing in the trace file has its information summarized and collected in one place in the TKPROF report.
- This information includes: the number of parse, execution & fetch operations, total CPU & elapsed times, buffers read in consistent (query) and current mode, blocks read from disk and row counts, Row Source operations, execution plans, library cache misses, parsing user id & optimizer mode
- The most important part of tkprof is the sort option. This helps us identify the most resource-intensive SQL statements and helps target efficiently the SQL tuning process
The syntax is given below
tkprof
Usage: tkprof tracefile outputfile [explain= ] [table= ]
[print= ] [insert= ] [sys= ] [sort= ]
table=schema.tablename   Use 'schema.tablename' with 'explain=' option.
explain=user/password    Connect to ORACLE and issue EXPLAIN PLAN.
print=integer    List only the first 'integer' SQL statements.
aggregate=yes|no
insert=filename  List SQL statements and data inside INSERT statements.
sys=no           TKPROF does not list SQL statements run as user SYS.
record=filename  Record non-recursive statements found in the trace file.
waits=yes|no     Record summary for any wait events found in the trace file.
sort=option      Set of zero or more of the following sort options:
prscnt  number of times parse was called
prscpu  CPU time parsing
prsela  elapsed time parsing
prsdsk  number of disk reads during parse
prsqry  number of buffers for consistent read during
parseprscu   number of buffers for current read during
parseprsmis  number of misses in library cache during
parseexecnt  number of execute was called
execpu  CPU time spent executing exeela  elapsed time executing
exedsk  number of disk reads during execute
exeqry  number of buffers for consistent read during execute
execu   number of buffers for current read during execute
exerow  number of rows processed during execute
exemis  number of library cache misses during execute
fchcnt  number of times fetch was called
fchcpu  cpu time spent fetching
fchela  elapsed time fetching
fchdsk  number of disk reads during fetch
fchqry  number of buffers for consistent read during fetch
fchcu   number of buffers for current read during fetch
fchrow  number of rows fetched
userid  userid of user that parsed the cursor
Since we are usually interested in tuning statements that take more time to run as time is the most important property in the tuning, so most commonly used sort options are the ones ordering according to elapsed times consumed for the parse, execute, and fetch phases
sort=prsela,exeela,fchela
tkprof examples
If you just want the tkprof without any filter
tkprof file.trc file.txt

If you just want the tkprof without recursive SQL  statement
What is recursive calls:f you insert a row into a table  that does not have enough space to hold that row, Oracle makes recursive calls to allocate the space dynamically. Recursive calls are also generated
when data dictionary information is not available in the data dictionary cache and must be retrieved from disk

tkprof file.trc file.txt sys=no

If you just want the tkprof with latest explain from the user executing it
tkprof file.trc file.txt sys=no explain=userid/password

If you just want the tkprof  with sort
tkprof file.trc file.txt sys=no explain=userid/password sort=prsela,exeela,fchela

This print 10 sql only
tkprof .trc elaps.prf sys=no explain=apps/ sort=(prsela,exeela,fchela) print=10

This print all the sql
tkprof .trc elaps.prf sys=no explain=apps/apps sort=prsela,exeela,fchela
Example content of tkprof file
TKPROF: Release 11.2.0.4.0 - Production on Tue Jan 17 14:12:41 2013
Copyright (c) 1982, 2007, Oracle.  All rights reserved.
Trace file: TEST_ora_15941.trc
Sort options: execpu  fchcpu
********************************************************************************
count    = number of times OCI procedure was executed
CPU      = CPU time in seconds executing
elapsed  = elapsed time in seconds executing
disk     = number of physical reads of buffers from disk
query    = number of buffers gotten for consistent read
current  = number of buffers gotten in current mode (usually for update)
rows     = number of rows processed by the fetch or execute call
********************************************************************************
SQL ID: 6w82ggrtysx
Plan Hash: 2325776775
SELECT FUNCTION_NAME    FROM FND_USER_DESKTOP_OBJECTS  WHERE USER_ID = :b1  AND APPLICATION_ID = :b2  AND  RESPONSIBILITY_ID = :b3  AND TYPE = 'FUNCTION'  AND ROWNUM <= 10 ORDER BY SEQUENCE
call     count       cpu    elapsed       disk      query    current        rows
------- ------  -------- ---------- ---------- ---------- ----------  ----------
Parse        1      0.00       0.00          0          0          0           0
Execute      1      0.00       0.00          0          0          0           0
Fetch        2      0.00       0.00          0          4          0           1
------- ------  -------- ---------- ---------- ---------- ----------  ----------
total        4      0.00       0.00          0          4          0           1
Misses in library cache during parse: 0
Optimizer mode: ALL_ROWS
Parsing user id: 173  (APPS)
Number of plan statistics captured: 1
Rows (1st) Rows (avg) Rows (max)  Row Source Operation
---------- ---------- ----------  ---------------------------------------------------
1          1          1  SORT ORDER BY (cr=4 pr=0 pw=0 time=0 us cost=6 size=41 card=1)
1          1          1   COUNT STOPKEY (cr=4 pr=0 pw=0 time=0 us)
1          1          1    TABLE ACCESS BY INDEX ROWID FND_USER_DESKTOP_OBJECTS (cr=4 pr=0 pw=0 time=0 us cost=5 size=41 card=1)
1          1          1     INDEX RANGE SCAN FND_USER_DESKTOP_OBJECTS_N1 (cr=3 pr=0 pw=0 time=0 us cost=3 size=0 card=3)(object id 33596)
Rows     Execution Plan
-------  ---------------------------------------------------
0  SELECT STATEMENT   MODE: ALL_ROWS
1   SORT (ORDER BY)
1    COUNT (STOPKEY)
1     TABLE ACCESS   MODE: ANALYZED (BY INDEX ROWID) OF
'FND_USER_DESKTOP_OBJECTS' (TABLE)
1      INDEX   MODE: ANALYZED (RANGE SCAN) OF
'FND_USER_DESKTOP_OBJECTS_N1' (INDEX)
Elapsed times include waiting on following events:
Event waited on                             Times   Max. Wait  Total Waited
----------------------------------------   Waited  ----------  ------------
SQL*Net message to client                       5        0.00          0.00
SQL*Net message from client                     5        0.00          0.00********************************************************************************
SQL ID: 276ut2ywqux
Plan Hash: 3856112528
select object_name, icon_name
from
fnd_desktop_objects
call     count       cpu    elapsed       disk      query    current        rows
------- ------  -------- ---------- ---------- ---------- ----------  ----------
Parse        1      0.00       0.00          0          0          0           0
Execute      1      0.00       0.00          0          0          0           0
Fetch        3      0.00       0.00          0          6          0          47
------- ------  -------- ---------- ---------- ---------- ----------  ----------
total        5      0.00       0.00          0          6          0          47
Misses in library cache during parse: 0
Optimizer mode: ALL_ROWS
Parsing user id: 173  (APPS)
Number of plan statistics captured: 1
Rows (1st) Rows (avg) Rows (max)  Row Source Operation
---------- ---------- ----------  ---------------------------------------------------
47         47         47  TABLE ACCESS FULL FND_DESKTOP_OBJECTS (cr=6 pr=0 pw=0 time=0 us cost=2 size=1175 card=47)
Rows     Execution Plan
-------  ---------------------------------------------------
0  SELECT STATEMENT   MODE: ALL_ROWS
47   TABLE ACCESS   MODE: ANALYZED (FULL) OF 'FND_DESKTOP_OBJECTS'
(TABLE)
Oracle trcsess utility
- When using shared server sessions, many processes are involved. The trace pertaining to the user session is scattered across different trace files belonging to different processes. This makes it difficult to get a complete picture of the life cycle of a session.
- The trcsess utility consolidates trace output from selected trace files based on several criteria
trcsess  [output=output_file_name] [session=session_id] [clientid=client_id] [service=service_name] [action=action_name] [module=module_name] [trace_files]

trcsess output=main.trc service=TEST  *trc
After the consolidated trace file has been generated you can execute tkprof on it.
How to read the tkprof file in Oracle
Once the tkprof is generated, Now we need to read it. Tkprof will contain several sql statement sections and it depends on the options chosen while generating the tkprof
Each sql statement section covers below important details
- The text of the SQLs executed.
- The execution count, elapsed time, CPU time, physical reads (disk), logical reads (query/current) and the number of rows returned for each SQL. This is further broken down into Parse, Execute and Fetch stages.

PARSE: This step translates the SQL statement into an execution plan. This includes checks for proper security authorization and checks or the existence of tables, columns, and other referenced objects.
EXECUTE: This step is the actual execution of the statement by Oracle.  For INSERT, UPDATE, and DELETE statements, this step modifies the data.  For SELECT statements, the step identifies the selected rows.
FETCH :This step retrieves rows returned by a query. Fetches are only performed for SELECT statements.
COUNT :Number of times a statement was parsed, executed, or fetched.
CPU :Total CPU time in seconds for all parse, execute, or fetch calls for the statement.
ELAPSED: Total elapsed time in seconds for all parse, execute, or fetch calls for the statement.
DISK: Total number of data blocks physically read from the datafiles on disk for all parse, execute, or fetch calls.
QUERY: Total number of buffers retrieved in consistent mode for all parse, execute, or fetch calls. Buffers are usually retrieved in consistent mode for queries.
CURRENT Total number of buffers retrieved in current mode. Buffers are often retrieved in current mode for INSERT, UPDATE, and DELETE statements.
- The runtime execution plan for each SQL with the actual row source operation counts for each execution plan line. It only does this if the row source statistics for the SQL have been written to the trace (See Extended SQL Trace). These statistics will not be included in any case if timed_statistics is not TRUE.
- The execution plan will also contain the actual tables accessed if the SQL uses views or synonyms.
- Library cache misses. These are “hard parses”; no execution plan is available in library cache and the optimizer has to determine an execution plan.
- The row source operation counts show the following for each execution plan line: rows, consistent reads (cr), physical reads (pr), physical writes(pw), time
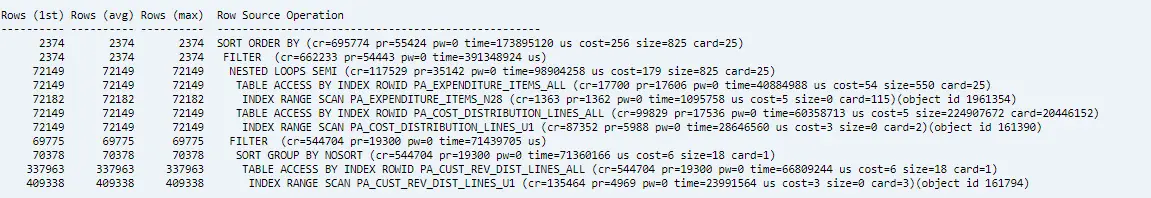
cr: Blocks retrieved through a logical read in the consistent mode
pr: Number of blocks read through a physical disk read
pw: Number of blocks written with a physical write to a disk
time: Total time (in milliseconds) spent processing the operation
cost: Estimated cost of the operation
size: Estimated amount of data (bytes) returned by the operation
card: Estimated number of rows returned by the operation
- The times waited, maximum wait and total waited for each database wait event, both for each SQL and for the whole period of the trace. It only does this if the level is 8 (with waits) or 12 (with waits and binds). At least level 8 is recommended because it gives this extra information.
You can easily find the longest sql and then work on tuning it
How to read the tkprof files in Oracle Sql Developer
If you have any SQL Trace (.trc) output files, you can display them in SQL Developer as an alternative to using the TKPROF program to format the contents of the trace file. To open a .trc file in SQL Developer and see an attractive, effective display of the information, click File, then Open, and specify the file; or drag the file’s name or icon into the SQL Developer window.
You can then examine the information in the List View, Statistics View, and History panes, with each pane including options for filtering and controlling the display.
How to read the tkprof files in Excel
Oracle has provided an Excel worksheet available through the link: Download Excel Macro (2M/xls) which has a macro “SetTKProf” that parses a TKProf file and applies filters for “Logical Reads”, “Elapsed Time”, “CPU Time”, “Countof Exectns”, “Physical Reads”, “Rows” and “%ge Recs Returned”.
Output
Statement;
table of quantitative information;
Misses in library cache during parse;
Optimizer goal;
Parsing user id;
Explain Plan;

There is also a table at the top of the sheet which displays a list of the highest values for each column in descending order to allow quick identification of the values to be looked at in the filters.
The normal way of working with this will be to open the TKProf file with Excel and then run the macro. However, occasionally a TKProf file will contain embedded TAB characters which will cause the macro to fail, in these cases open the file with Notepad or a similar program ,Cut and Paste the text into a blank Excel Worksheet and then run the Macro.
Related Articles
SQL trace: SQL trace or 10046 event is being used to trace the session activity in Oracle.
Autotrace in oracle: Autotrace in Oracle, What is autotrace, how to set up it, Understanding Autotrace Output, Autotrace options, statistics displayed by autotrace
sql tuning advisor: How to run sql tuning advisor for SQL_ID in the Cursor cache, how is the sql tuning task created and executed to get the recommendation
Hanganalyze: check out how to take system state dump in Oracle, hanganalyze in Oracle, what is v$wait_chains, and how it can help find the blocking
How to generate FRD trace in Oracle Apps: How to generate Forms runtime diagnostics trace in Oracle apps 11i/R12
How to generate tkprof in EBS in 19c
Troubleshooting TKProf Runtime Errors (Doc ID 1383275.1)