Autotrace is a utility in Oracle that can be used to analyze the execution plan and performance of SQL statements. It is a command-line tool that provides detailed information about how a SQL statement is executed, including the number of rows returned, the amount of time it takes to execute, and the resources used during execution
What is Autotrace Utility
- Autotrace is a beautiful tool Oracle provides for explain plan and execution statistics.
- You need to know the query and its bind variable if any and with autotrace access, we can get all the useful information about
- Similar to the Explain Plan
- Provides plan – without having to perform separate queries from PLAN_TABLE
- Provides statistics
- Note: Does not support bind variables
Autotrace Utility installation
- cd [ORACLE_HOME]/rdbms/admin
- log into SQL*Plus as SYSTEM
- Run @utlxplan
- Run CREATE PUBLIC SYNONYM PLAN_TABLE FOR PLAN_TABLE;
- Run GRANT ALL ON PLAN_TABLE TO PUBLIC;
- Log in to SQL*Plus as SYS or as SYSDBA
- Run @plustrce
- Run GRANT PLUSTRACE TO PUBLIC;
Autotrace options
SET AUTOTRACE OFF: No AUTOTRACE report is generated. This is the default.
SET AUTOTRACE ON EXPLAIN: The AUTOTRACE report shows only the optimizer execution path.
SET AUTOTRACE ON STATISTICS: The AUTOTRACE report shows only the SQL statement execution statistics.
SET AUTOTRACE ON: The AUTOTRACE report includes both the optimizer execution path and the SQL statement execution statistics.
SET AUTOTRACE TRACEONLY: This is like SET AUTOTRACE ON, but it suppresses the printing of the user’s query output, if any. This is very useful for queries returning large rows, so we do not need to scroll down that much
SET AUTOTRACE TRACEONLY STATISTICS: This is like SET AUTOTRACE TRACEONLY but it shows the statistics only and suppresses the explain plan output
SET AUTOTRACE TRACEONLY EXPLAIN: This is like SET AUTOTRACE TRACEONLY but it shows the explain plan only and suppresses the statistics. This does not execute the select statement, just parses the statement and shows the explain plan. INSERT/UPDATE are executed and then explain plan shown
Understanding Autotrace Output
Autotrace shows two things
(a) Explain plan: Explain plan shows the plan for the query and it shows exactly how the query will be executed in the Database.It will show the cost, cardinality, and bytes for each step in the explain plan. Execution Plan produced by Autotrace contains the following:
(i)The line number of each execution step
(ii)The relationship number between each step and its parent
(iii)Each step of the plan
shows any database links or parallel servers used
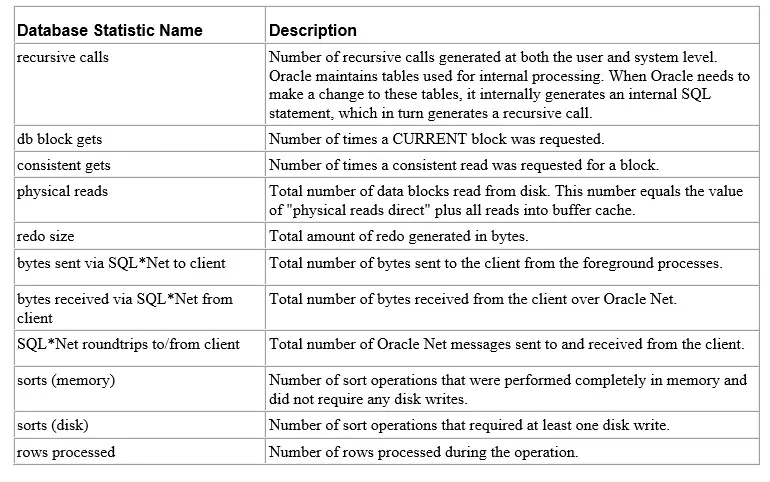
(b) Statistics: Lots of statistics will be shown. Some of the statistics are
(i) Recursive calls: Number of sql statements executed in order to execute the statement
(ii) DB block gets: The no of blocks read from buffer cache in current mode
(iii) Consistent gets: The no of blocks read from the buffer cache in consistent reads
(iv)redo size: redo generated by sql
(v) Physical reads: No of disk reads
Syntax
set autotrace { off | on | traceonly } [explain] [statistics]
Example
SQL> create table TEST as select * from dba_objects where rownum < 100000; SQL> set autotrace traceonly SQL> select * from TEST where object_name = 'FND_USER'; Execution Plan | Id | Operation | Name | Rows | Bytes | Cost (%CPU)| Time | | 0 | SELECT STATEMENT | | 8 | 1416 | 156 (2)| 00:00:02 | |* 1 | TABLE ACCESS FULL| VIRTUAL_TEST_T | 8 | 1416 | 156 (2)| 00:00:02 | Statistics0 recursive calls0 db block gets15 consistent gets3 physical reads0 redo size408 bytes sent via SQL*Net to client355 bytes received via SQL*Net from client2 SQL*Net roundtrips to/from client0 sorts (memory)0 sorts (disk)1 rows processed
How to Read the Statistics
Logical Reads = Consistent Gets + DB Block Gets
Logical Reads = 15 + 0
Logical Reads = 15
Rows Processed = 1
That means we had to read 15 blocks to find 1 rows
The Statistics Definition is given below
I hope you like this post on Autotrace in the Oracle database. This is quite a useful utility
Also Reads
Virtual Index in Oracle
tkprof utility
SQL trace in Oracle: SQL trace or 10046 event is being used to trace the session activity in Oracle.
sql tuning advisor: How to run sql tuning advisor for “SQL_ID” in the Cursor cache, how is the sql tuning task created and executed to get the recommendation
https://docs.oracle.com/cd/B10501_01/server.920/a96533/autotrac.htm
Thank you …
Thanks Mahesh