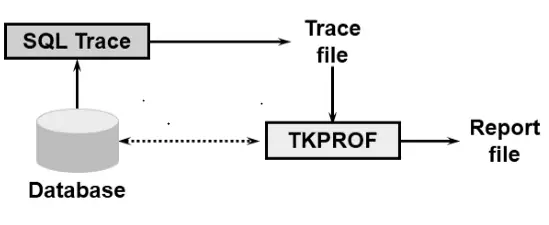
- Tracing is an important part of Oracle database tuning. This will help capture all the problem statements and waitevents that are responsible for the slow running of the session.
- Oracle database has provided many quickest ways to trace the local session, and other user sessions and format the trace to make it readable
- SQL tracing finds out below things for each sql statement executed
- parse, execute, and fetch counts
- CPU and elapsed times
- physical reads and logical reads
- number of rows processed
- misses on the library cache
- the username under which each parse occurred
- each commit and rollback
Let us take a look at how to turn on SQL trace, 10046 events in the Oracle database
How to enable SQL Trace (10046 events)
If you want to enable trace in a local session, here are the steps to turn on SQL trace
Normal trace

alter session set sql_trace = true;  -- To put trace on

alter session set sql_trace = false;  -- To put trace off

Full level with wait event And bind trace

alter session set events = '10046 trace name context forever, level 12';

To put tracing off

alter session set events = '10046 trace name context off';

Same as Normal trace

exec DBMS_SESSION.set_sql_trace(sql_trace => TRUE);

exec DBMS_SESSION.set_sql_trace(sql_trace => FALSE);
If you want to trace in another running session, here are the steps
Normal trace

execute dbms_system.set_sql_trace_in_session ('&sid','&serial',true);  -- To put tracing on

execute dbms_system.set_sql_trace_in_session ('&sid’,'&serial',true);   -- To put tracing off

Full level with wait event And bind trace

execute dbms_system.set_ev('&sid','&serial',10046,12,'');

To put trace off

execute dbms_system.set_ev('&sid','serial',10046,0,'');
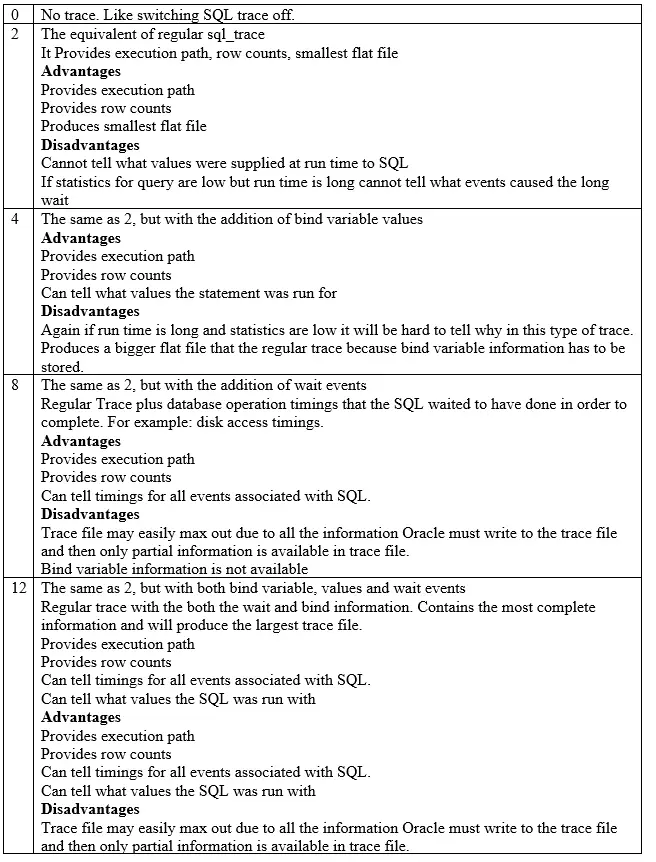
You must have seen using 12,0 in various statements above. They are tracing levels. Oracle Tracing has below tracing levels. Here are the valid values
There are other ways to do the tracing also. Here are some of these
(1) ORADEBUG
This requires login as sysdba
oradebug setospid   1111   -- Debug session with the specified Oracle  process id

oradebug setorapid  1111  --- Debug session with the specified OS process

oradebug event 10046 trace name context forever, level 4;

oradebug event 10046 trace name context off;   --- This disable the trace

oradebug close_trace  --- This closes  the trace file

Oradebug TRACEFILE_NAME;
(2) With Oracle 10g the SQL tracing options have been extended using the DBMS_MONITOR package
EXECUTE dbms_monitor.session_trace_enable

Which is similar

ALTER SESSION SET EVENTS '10046 trace name context forever, level 2';

EXECUTE dbms_monitor.session_trace_enable (binds=>true);

Which is similar

ALTER SESSION SET EVENTS '10046 trace name context forever, level 4';

EXECUTE dbms_monitor.session_trace_enable (waits=>true);

Which is similar

ALTER SESSION SET EVENTS '10046 trace name context forever, level 8';

EXECUTE dbms_monitor.session_trace_enable('sid','serial#')

Which is similar

execute dbms_system.set_ev('sid','serial',10046,2,'');

EXECUTE dbms_monitor.session_trace_enable ('sid','serial#',binds=>true);

Which is similar

execute dbms_system.set_ev(‘sid’,’serial’,10046,4,’’);

EXECUTE dbms_monitor.session_trace_enable ('sid','serial#',waits=>true);

Which is similar

execute dbms_system.set_ev(‘sid’,’serial’,10046,8,’’);
There are many other functionalities available in dbms_monitor. We can enable trace based on client identifiers and multiple ways
How to identify the Trace files
SQL trace files are written to the directory
<diagnostic_dest>/diag/rdbms/<dbname>/<instname>/trace
Where is specified in the initialization parameter diagnostic_dest.
This can be obtained by running the SQL:
SELECT value FROM V$DIAG_INFO WHERE NAME = 'Diag Trace';
We can identify the trace files using the spid of the session. Also, the trace file will contain the “sid, serial#” pair at the start of the trace file.
The below query can be used to find the local session trace file
select c.value || '/' || d.instance_name ||'_ora_' || a.spid || '.trc' trace
from v$process a, v$session b, v$parameter c, v$instance d
where a.addr = b.paddr
and b.audsid = userenv('sessionid')
and c.name = 'user_dump_dest'
/
There is another easy way to identify the trace file which is called a trace identifier
alter session set tracefile_identifer=’ORAC’; This is identifier
Example trace file
Trace file /app/oracle/TEST/diag/rdbms/test/TEST/trace/TEST_ora_13025_IDEN.trc
Oracle Database 11g Enterprise Edition Release 11.2.0.4.0 - 64bit Production
With the Partitioning, Real Application Clusters, OLAP, Data Mining and Real Application Testing options
ORACLE_HOME = /app/oracle/TEST/11.2.0/db
System name:    SunOS12
Node name: sun12Release:   5.10Version:   Generic_144488-11
Machine:   sun4u
Instance name: TEST
Redo thread mounted by this instance: 1
Oracle process number: 202
Unix process pid: 13025, image: oracle@ SunOS12
*** 2013-10-21 12:28:56.461
*** SESSION ID:(3875.17341) 2013-10-21 12:28:56.461*** CLIENT ID:() 2013-10-21 12:28:56.461
*** SERVICE NAME:(TEST) 2013-10-21 12:28:56.461
*** MODULE NAME:(STANDARD@sunOS12(TNS V1-V3)) 2013-10-21 12:28:56.461
*** ACTION NAME:() 2013-10-21 12:28:56.461
CLOSE #4:c=0,e=11,dep=1,type=1,tim=8866891135825
=====================
PARSING IN CURSOR #5 len=356 dep=1 uid=173 oct=3 lid=173 tim=8866891136821 hv=2468783182 ad='4c70e4398' sqlid='0wmwsjy9kd92f'SELECT PROFILE_OPTION_ID, APPLICATION_ID, SITE_ENABLED_FLAG , APP_ENABLED_FLAG , RESP_ENABLED_FLAG , USER_ENABLED_FLAG, ORG_ENABLED_FLAG , SERVER_ENABLED_FLAG, SERVERRESP_ENABLED_FLAG, HIERARCHY_TYPE, USER_CHANGEABLE_FLAG FROM FND_PROFILE_OPTIONS WHERE PROFILE_OPTION_NAME = :B1 AND START_DATE_ACTIVE <= SYSDATE AND NVL(END_DATE_ACTIVE, SYSDATE) >= SYSDATEEND OF STMT
BINDS #5:
Bind#0
oacdty=01 mxl=128(80) mxlc=00 mal=00 scl=00 pre=00
oacflg=03 fl2=1206001 frm=01 csi=871 siz=128 off=0
kxsbbbfp=ffffffff7d677b48  bln=128  avl=21  flg=0
value="PER_BUSINESS_GROUP_ID"
EXEC #5:c=0,e=1474,p=0,cr=0,cu=0,mis=0,r=0,dep=1,og=1,plh=1374985481,tim=8866891138224
FETCH #5:c=0,e=61,p=0,cr=3,cu=0,mis=0,r=1,dep=1,og=1,plh=1374985481,tim=8866891138429
CLOSE #5:c=0,e=5,dep=1,type=3,tim=8866891138503
=====================
PARSING IN CURSOR #4
 len=230 dep=1 uid=173 oct=3 lid=173 tim=8866891138634 hv=3575592451 ad='3aeea3da0' sqlid='55dc767ajydh3'
SELECT PROFILE_OPTION_VALUE FROM FND_PROFILE_OPTION_VALUES WHERE PROFILE_OPTION_ID = :B4 AND APPLICATION_ID = :B3 AND LEVEL_ID = 10003 AND LEVEL_VALUE = :B2 AND LEVEL_VALUE_APPLICATION_ID = :B1 AND PROFILE_OPTION_VALUE IS NOT NULL
END OF STMT
BINDS #4:
Bind#0
oacdty=02 mxl=22(21) mxlc=00 mal=00 scl=00 pre=00
oacflg=03 fl2=1206001 frm=00 csi=00 siz=96 off=0
kxsbbbfp=ffffffff7d677b68  bln=22  avl=03  flg=05
value=1204
Bind#1
oacdty=02 mxl=22(21) mxlc=00 mal=00 scl=00 pre=00
oacflg=03 fl2=1206001 frm=00 csi=00 siz=0 off=24
kxsbbbfp=ffffffff7d677b80  bln=22  avl=02  flg=01
value=800
Bind#2
oacdty=02 mxl=22(21) mxlc=00 mal=00 scl=00 pre=00
oacflg=03 fl2=1206001 frm=00 csi=00 siz=0 off=48
kxsbbbfp=ffffffff7d677b98  bln=22  avl=04  flg=01
value=50334
Bind#3
oacdty=02 mxl=22(21) mxlc=00 mal=00 scl=00 pre=00
oacflg=03 fl2=1206001 frm=00 csi=00 siz=0 off=72
kxsbbbfp=ffffffff7d677bb0  bln=22  avl=01  flg=01
value=0
EXEC #4:c=0,e=377,p=0,cr=0,cu=0,mis=0,r=0,dep=1,og=1,plh=2802907561,tim=8866891138978
FETCH #4:c=0,e=26,p=0,cr=3,cu=0,mis=0,r=0,dep=1,og=1,plh=2802907561,tim=8866891139050
CLOSE #4:c=0,e=2,dep=1,type=3,tim=8866891139116
=====================
PARSING IN CURSOR #5
len=191 dep=1 uid=173 oct=3 lid=173 tim=8866891139308 hv=303338305 ad='3bedf0e48' sqlid='7qs7fx89194u1'
SELECT PROFILE_OPTION_VALUE FROM FND_PROFILE_OPTION_VALUES WHERE PROFILE_OPTION_ID = :B4 AND APPLICATION_ID = :B3 AND LEVEL_ID = :B2 AND LEVEL_VALUE = :B1 AND PROFILE_OPTION_VALUE IS NOT NULL
END OF STMT
BINDS #5:
Bind#0
oacdty=02 mxl=22(21) mxlc=00 mal=00 scl=00 pre=00
oacflg=03 fl2=1206001 frm=00 csi=00 siz=96 off=0
kxsbbbfp=ffffffff7d673b78  bln=22  avl=03  flg=05
value=1204
Bind#1
oacdty=02 mxl=22(21) mxlc=00 mal=00 scl=00 pre=00
oacflg=03 fl2=1206001 frm=00 csi=00 siz=0 off=24
kxsbbbfp=ffffffff7d673b90  bln=22  avl=02  flg=01
value=800
Bind#2
oacdty=02 mxl=22(21) mxlc=00 mal=00 scl=00 pre=00
oacflg=03 fl2=1206001 frm=00 csi=00 siz=0 off=48
kxsbbbfp=ffffffff7d673ba8  bln=22  avl=04  flg=01
value=10001
How to check if the trace is enabled in Oracle
If you have enabled tracing using the DBMS_MONITOR package, we can check if the trace is enabled using the below query
set lines 180
col module for a45
col sql_trace_waits for a20
col sql_trace_binds for a20
col sql_trace for a20
select username,module,sid,sql_trace,sql_trace_waits,sql_trace_binds from v$session where sql_trace='ENABLED'
/
If it is enabled through other methods, then the only way to check is to look at the trace location and find out the recent trace files and then find the sid and serial# in it and then you can query v$session to find the session and you can disable the trace if you want
Sql trace in 11g and above
In 11g and higher, sql_trace is also an event and can be set with event syntax:
SQL> oradebug doc event name sql_trace

sql_trace: event for sql trace

Usage
-------
sql_trace
wait < false | true >,
bind < false | true >,
plan_stat < never | first_execution | all_executions | adaptive >,
level <ub4>
So you could use it as follows to enable SQL_TRACE requesting bind information:
alter session set events 'sql_trace bind=true';
or bind and wait for information (notice comma separated):
alter session set events 'sql_trace bind=true, wait=true';
Further trace can be limited to a set of SQL_IDs if you include a filter for it. E.g.
alter session set events 'sql_trace [sql: sql_id=g3yc1js3g2689 | sql_id=7ujay4u33g337]bind=true, wait=true';
10046 EVENT levels: (the new sql_trace values are included in [..])
These are bit values so can be put together to get different mixes
1 – Enable standard SQL_TRACE functionality (Default)
4 – As Level 1 PLUS trace bind values [ bind=true ]
8 – As Level 1 PLUS trace waits [ wait=true ]
This is especially useful for spotting latch wait etc.
but can also be used to spot full table scans and index scans.
As of 11g these additional bit levels are available:
16 – Generate STAT line dumps for each execution [ plan_stat=all_executions ]
32 – Never dump execution statistics [ plan_stat=never ]
As of 11.2.0.2 this additional bit level is available:
64 – Adaptive dump of STAT lines. [ plan_stat=adaptive ]
This dumps the STAT information if a SQL took more than about 1 minute thereby
giving information for the more expensive SQLs and for different executions of such
SQLs.
eg: A common event level is 12 which includes standard SQL_TRACE output, binds, waits, and
default STAT line tracing.
Notes:
STAT dumping has been amended in 11g so that they are not aggregated across all executions but are dumped after execution. This has been done to address cases where the cursor is not closed and the STAT information is not dumped.
Now we guarantee to capture the STAT information following the execution. See the above bit levels to have finer control over STAT lines.
Size of trace files
- The trace file size is limited by the parameter MAX_DUMP_FILE_SIZE. The unit of this parameter, if you don’t specify the K or M option, is in OS block size.
- Be sure this parameter is set to a value high enough to generate all the content.
- Generally, we ask them to set it to unlimited but we need to monitor the trace location for filesystem full issues
timed_statistics Parameter
- The initialization parameter timed_statistics must be set to TRUE when obtaining an SQL Trace.
- If timed_statistics is set to FALSE then the SQL Trace file will not contain the following important information: Row source statistics (STAT lines), CPU timings
- If the initialization parameter statistics_level is set to ALL or TYPICAL then timed_statistics will be TRUE by default.
- Note that timed_statistics cannot be set to FALSE if statistics_level = ALL or TYPICAL.
- If statistics_level is set to BASIC then timed_statistics will be FALSE by default, but it can be explicitly set to TRUE.
Also Reads
v$active_session_history
explain plan in Oracle
sql tuning Advisor
Oracle tkprof utility : How to generate and and read
Thanks so much for the all the detailed and well organized information. Much appreciated!