What is Data Skew
- Data skew primarily refers to a non-uniform distribution in a data set. A non-uniform distribution might impact the system if the proper execution plan is not selected depending on the data values.
- Data is generally said to be skewed if there is presence of significant popular values in the column. But it can happen with non-uniformity of the range also. Let us go through examples for both to properly understand it.
Examples of Data Skew
(1) non-uniformity in the repetitions of values or value skew. It basically means some values appear more than others
This is the case when the column has few distinct values and some values appear more than others.
Example.
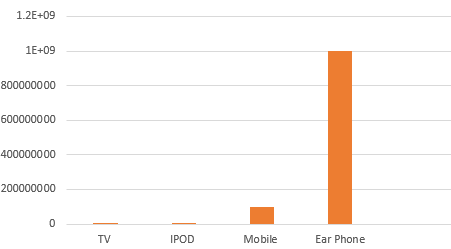
Products sold by Electronics companies
TV : 10000
IPOD :10000
Mobile : 100000000
Ear Phone: 1000000000
Let’s take a look at a couple of simple queries:
select sum(order_amount) from sales_details where item = 'TV'; [1200 rows match]
select sum(order_amount) from sales_details where item = 'MOBILE'; [1000000000 rows match]
For the above queries, the number of rows matching the WHERE clause is very different so it would be useful to give the optimizer a way to figure this out. Histogram is the solution to these problems
(2) there is a non-uniformity in range or range skew
Let’s take the previous example only. We have more Sales during Oct Month, then other month
select to_char(sales_date,"MON") "Month"
,count(*) "Number of sales in Month"
from sales_detail
group by to_char(sales_date,"MON")
order by to_char(sales_date,"MON");

You will see variation in the count returned from the rows
JAN 1000
FEB 100
MAR 1245
---
OCT 1456756585
NOV 100000
DEC 1557558
Now this non-uniformity in range or range skew
Let’s take a look at a couple of simple queries:
select sum(order_amount) from sales_details where sales_date between to_date('01-JAN-2018') and to_date('31-MAR-2018');

select sum(order_amount) from sales_details where sales_date between to_date('01-OCT-2018') and to_date('31-DEC-2018');
The first query will match a small number of rows and the second will match a large number of rows even though the size of the range is the same in both cases
So if we provide more details to the optimizer, it will be helpful in choosing the plan
We could similar examples with text-based columns also
How to solve the Data skew problem
Histogram is the solution for the data skew. Histogram will make the optimizer aware of these gaps. With a histogram, the optimizer will yield better cardinality estimates.
Histograms are created by default in the Oracle database. The database encodes column values and uses statistical techniques to characterize the degree of variation in cardinality estimates when a range-based query predicate is used. Once this analysis is complete, internal thresholds are used to decide whether or not a histogram will be useful.
The net result is that text-based columns will often acquire histograms if they are used in range-based query predicates.
Related Articles
Oracle Performance tuning Glossary
Optimizer Mode
Gathering Statistics in Release 11i and R12
What is a Bind Variable
How are the histograms generated in Oracle
Histograms in EBS
Histograms queries in Oracle